Project 5 Vehicle Detection
Term 1 Project 5 Udacity Self Driving Car Nanodegree
Project 5 in Term 1 is where we pick out cars from images and then videos. We had been working on lane lines and traffic signs up until this point but lane lines and traffic signs all look similar and fairly consistently. How does a car look? What about different styles and colours of cars not to mention nears cars are big far away small. In this project we grapple with these issues as we extract and mark vehicles from a movie stream. We use Scikit Image and Scikit Learn Libraries to help us.
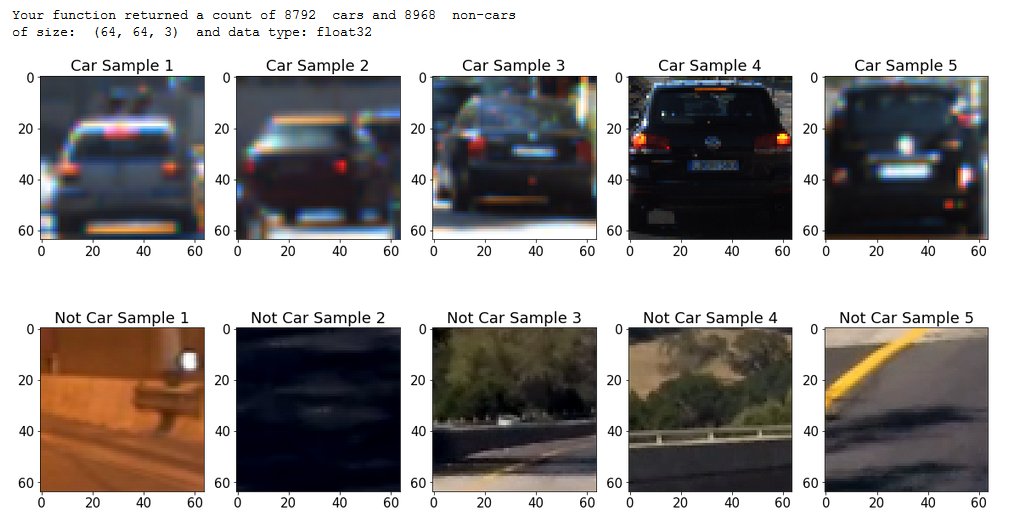
So how do we teach a computer what a vehicle looks like when it is not something clearly defined like a lane line? We take many examples of cars and many examples of things that are not cars and train the computer on those images. I used about 30,000 images in all. Fortunately I didn’t have to take them myself. Udacity do a great job of introducing us to academic and industry standard data sets and sources. There are two used for this project.The KITTI Vision Benchmark Suite which is a project between Karlsruhe Institute of Technology and Toyota Technological Institute at Chicago and also the GTI Database from the Universidas Politecnica de Madrid. Above you can see 5 examples of cars and 5 or things that are not cars from the data sets.
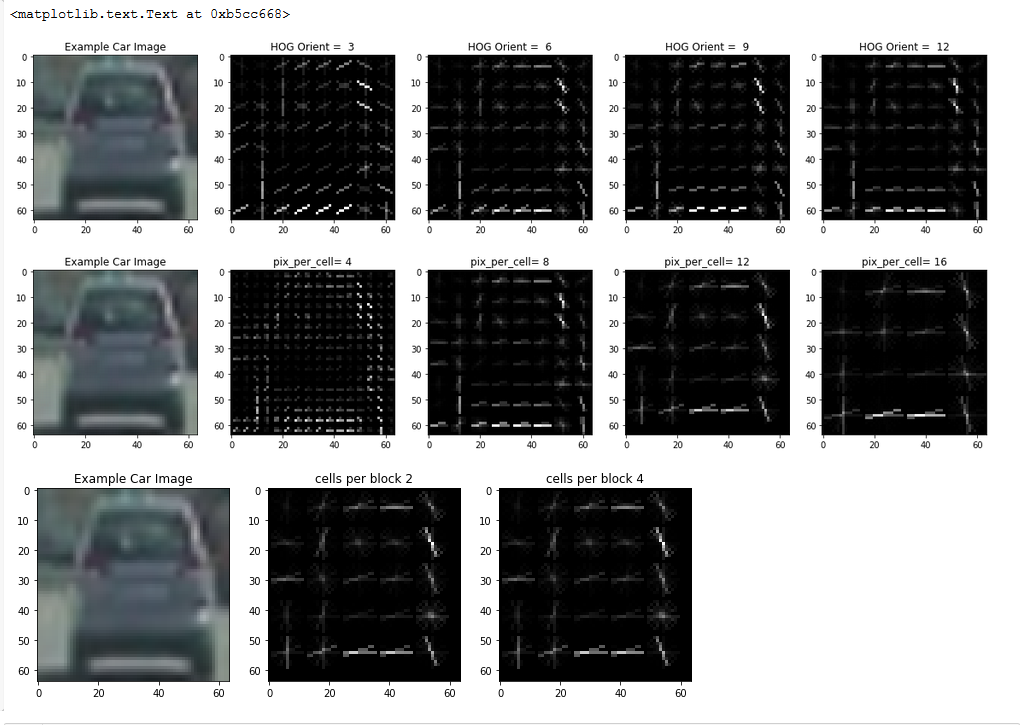
We we have here is a HOG! A Histogram Of Gradient that is. This is a techniques from the SciKit Image Library and it marks where there is rapid change in contrast or color in an image and so give a kind of outline. Various parameters for the techniques are experimented with here to give above results. These parameters effect the overall performance in terms of speed and accuracy in the project.
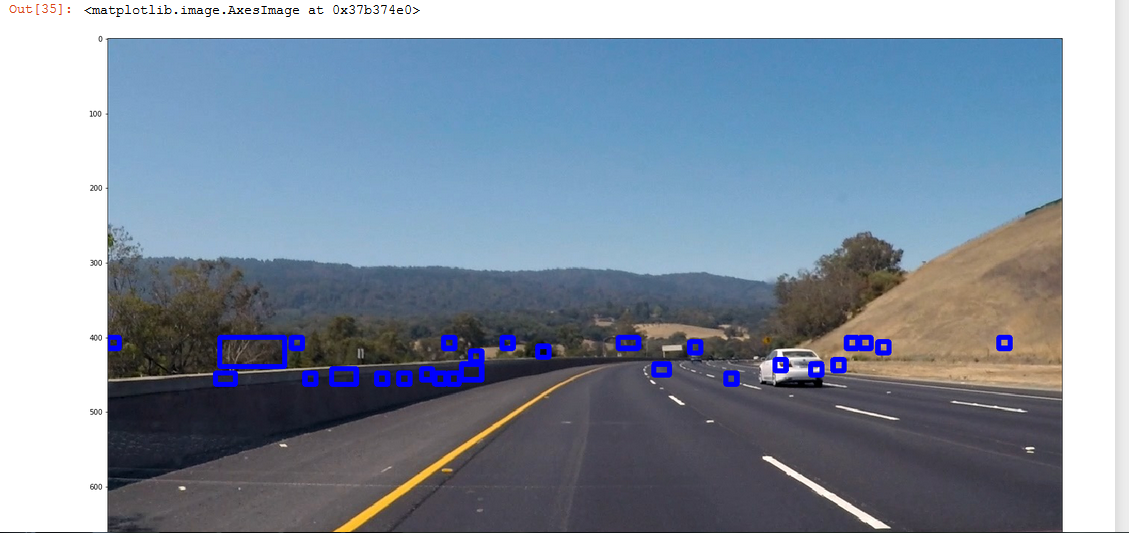
What about near and far? Near cars are big, far cars small , how do we account for that. In the above image you can see many small rectangles. This is because I am looking for far away targets in the middle of the image which is where a far away car would be. As it turns out there are loads of false matches as the computer thinks everything from the grass to the crash barrier is a match. So this particular experiment did not work but it is a good example of how you can learn from poor results. I did have a good idea to search only a section of ht image for small targets but the search criteria was not accurate enough so I changed the criteria not the whole idea.
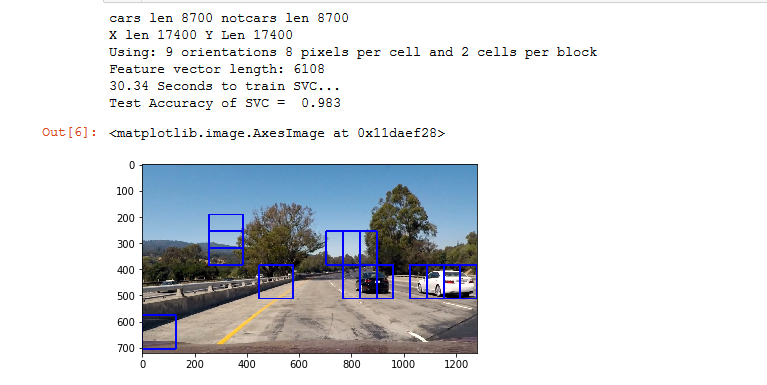
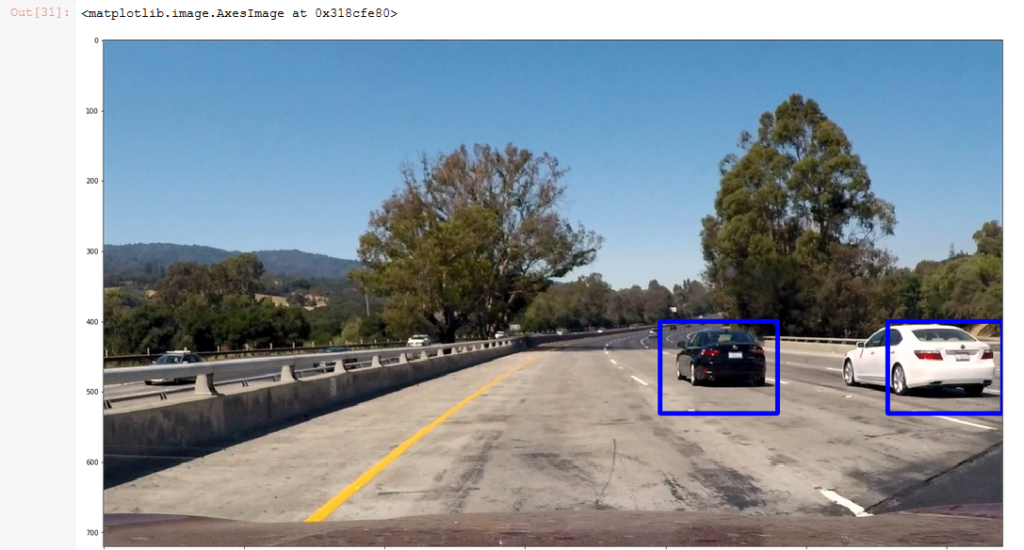
Here I am using larger search windows to generate results. Some are accurate some not. Why did I look up in the trees this time? When a vehicle like a truck is very close potentially it could take up from the lower edge to the upper part of the image so that’s why I am searching with big squares high and low in the image. There are some good results around the black and white car, but still too many false matches. Also of note here is the fact that there is lots of information above the image. What I am doing here is displaying all the settings I am using so that I can keep track of what I am doing. While experimenting like this there are some many variables to adjust and permutations to keep track of that it can get confusing so its better to display everything and save it for reference.
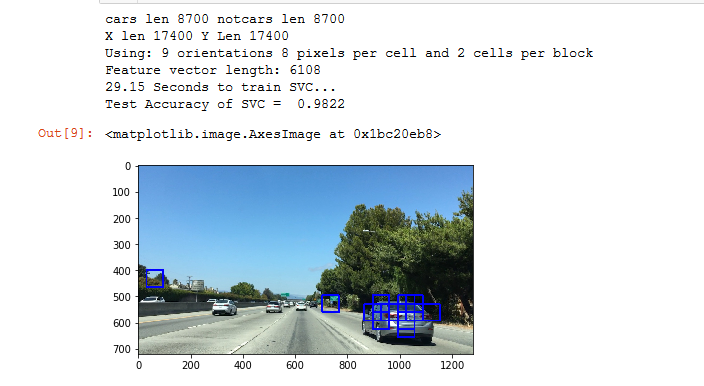
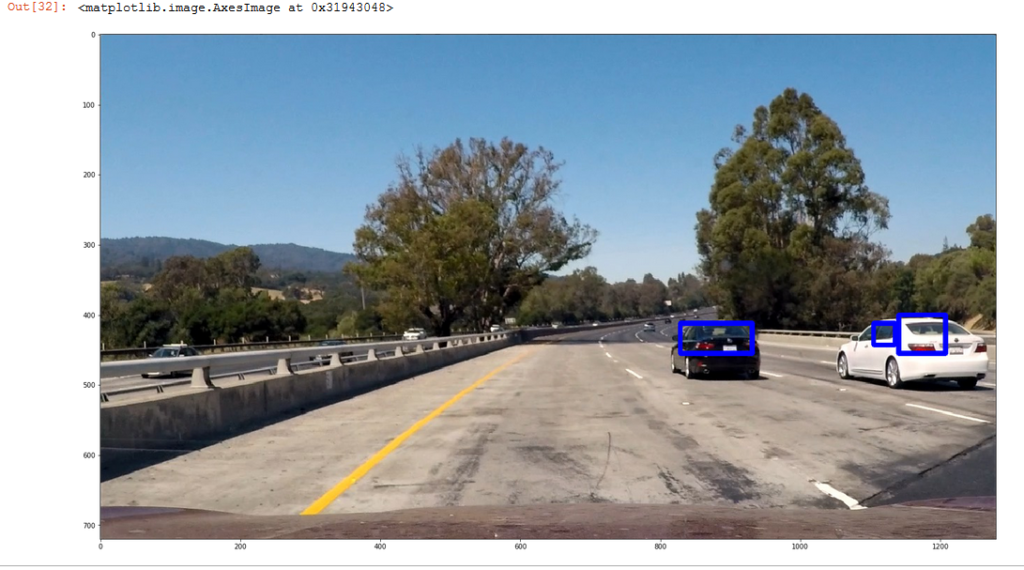
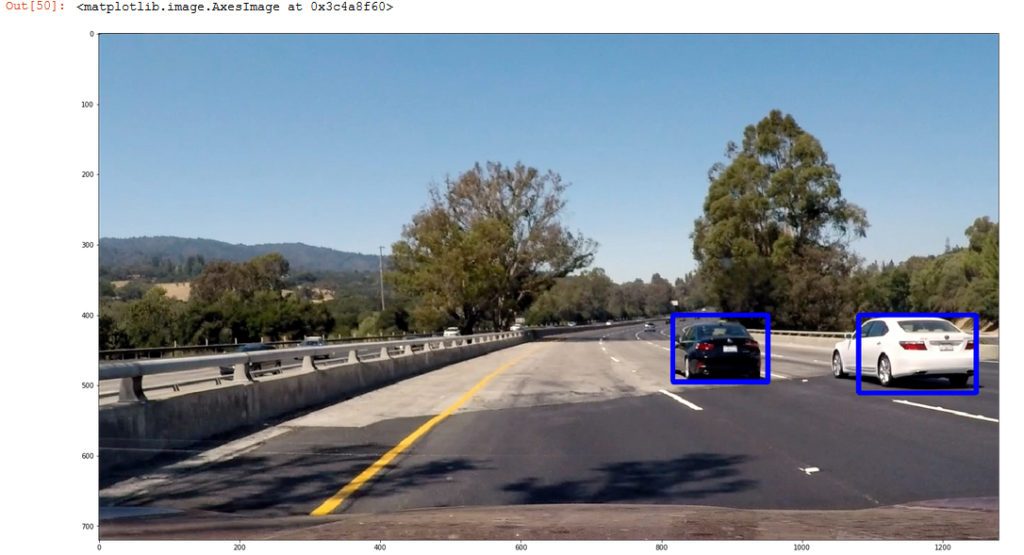
The next image shows the same setting except one called the scale is changed, this makes the boxes a different size. It seems to work much better. And so these projects progress by lots of experimentation . Eventually I decide to use different box sizes the medium and the large discarding the smallest as it is too unreliable and when it does work the other sizes catch the same vehicles as shown below.

Functional Safety
Path Planning
PID
Particle Filter
Unscented Kalman Filter
Kalman Filter
Behavioral Cloning
Advanced Lane Lines

Traffic Sign Classifier
Finding Lane Lines
